

The All-In-One
Repository & Reporting Solution
For Your Retail Data.
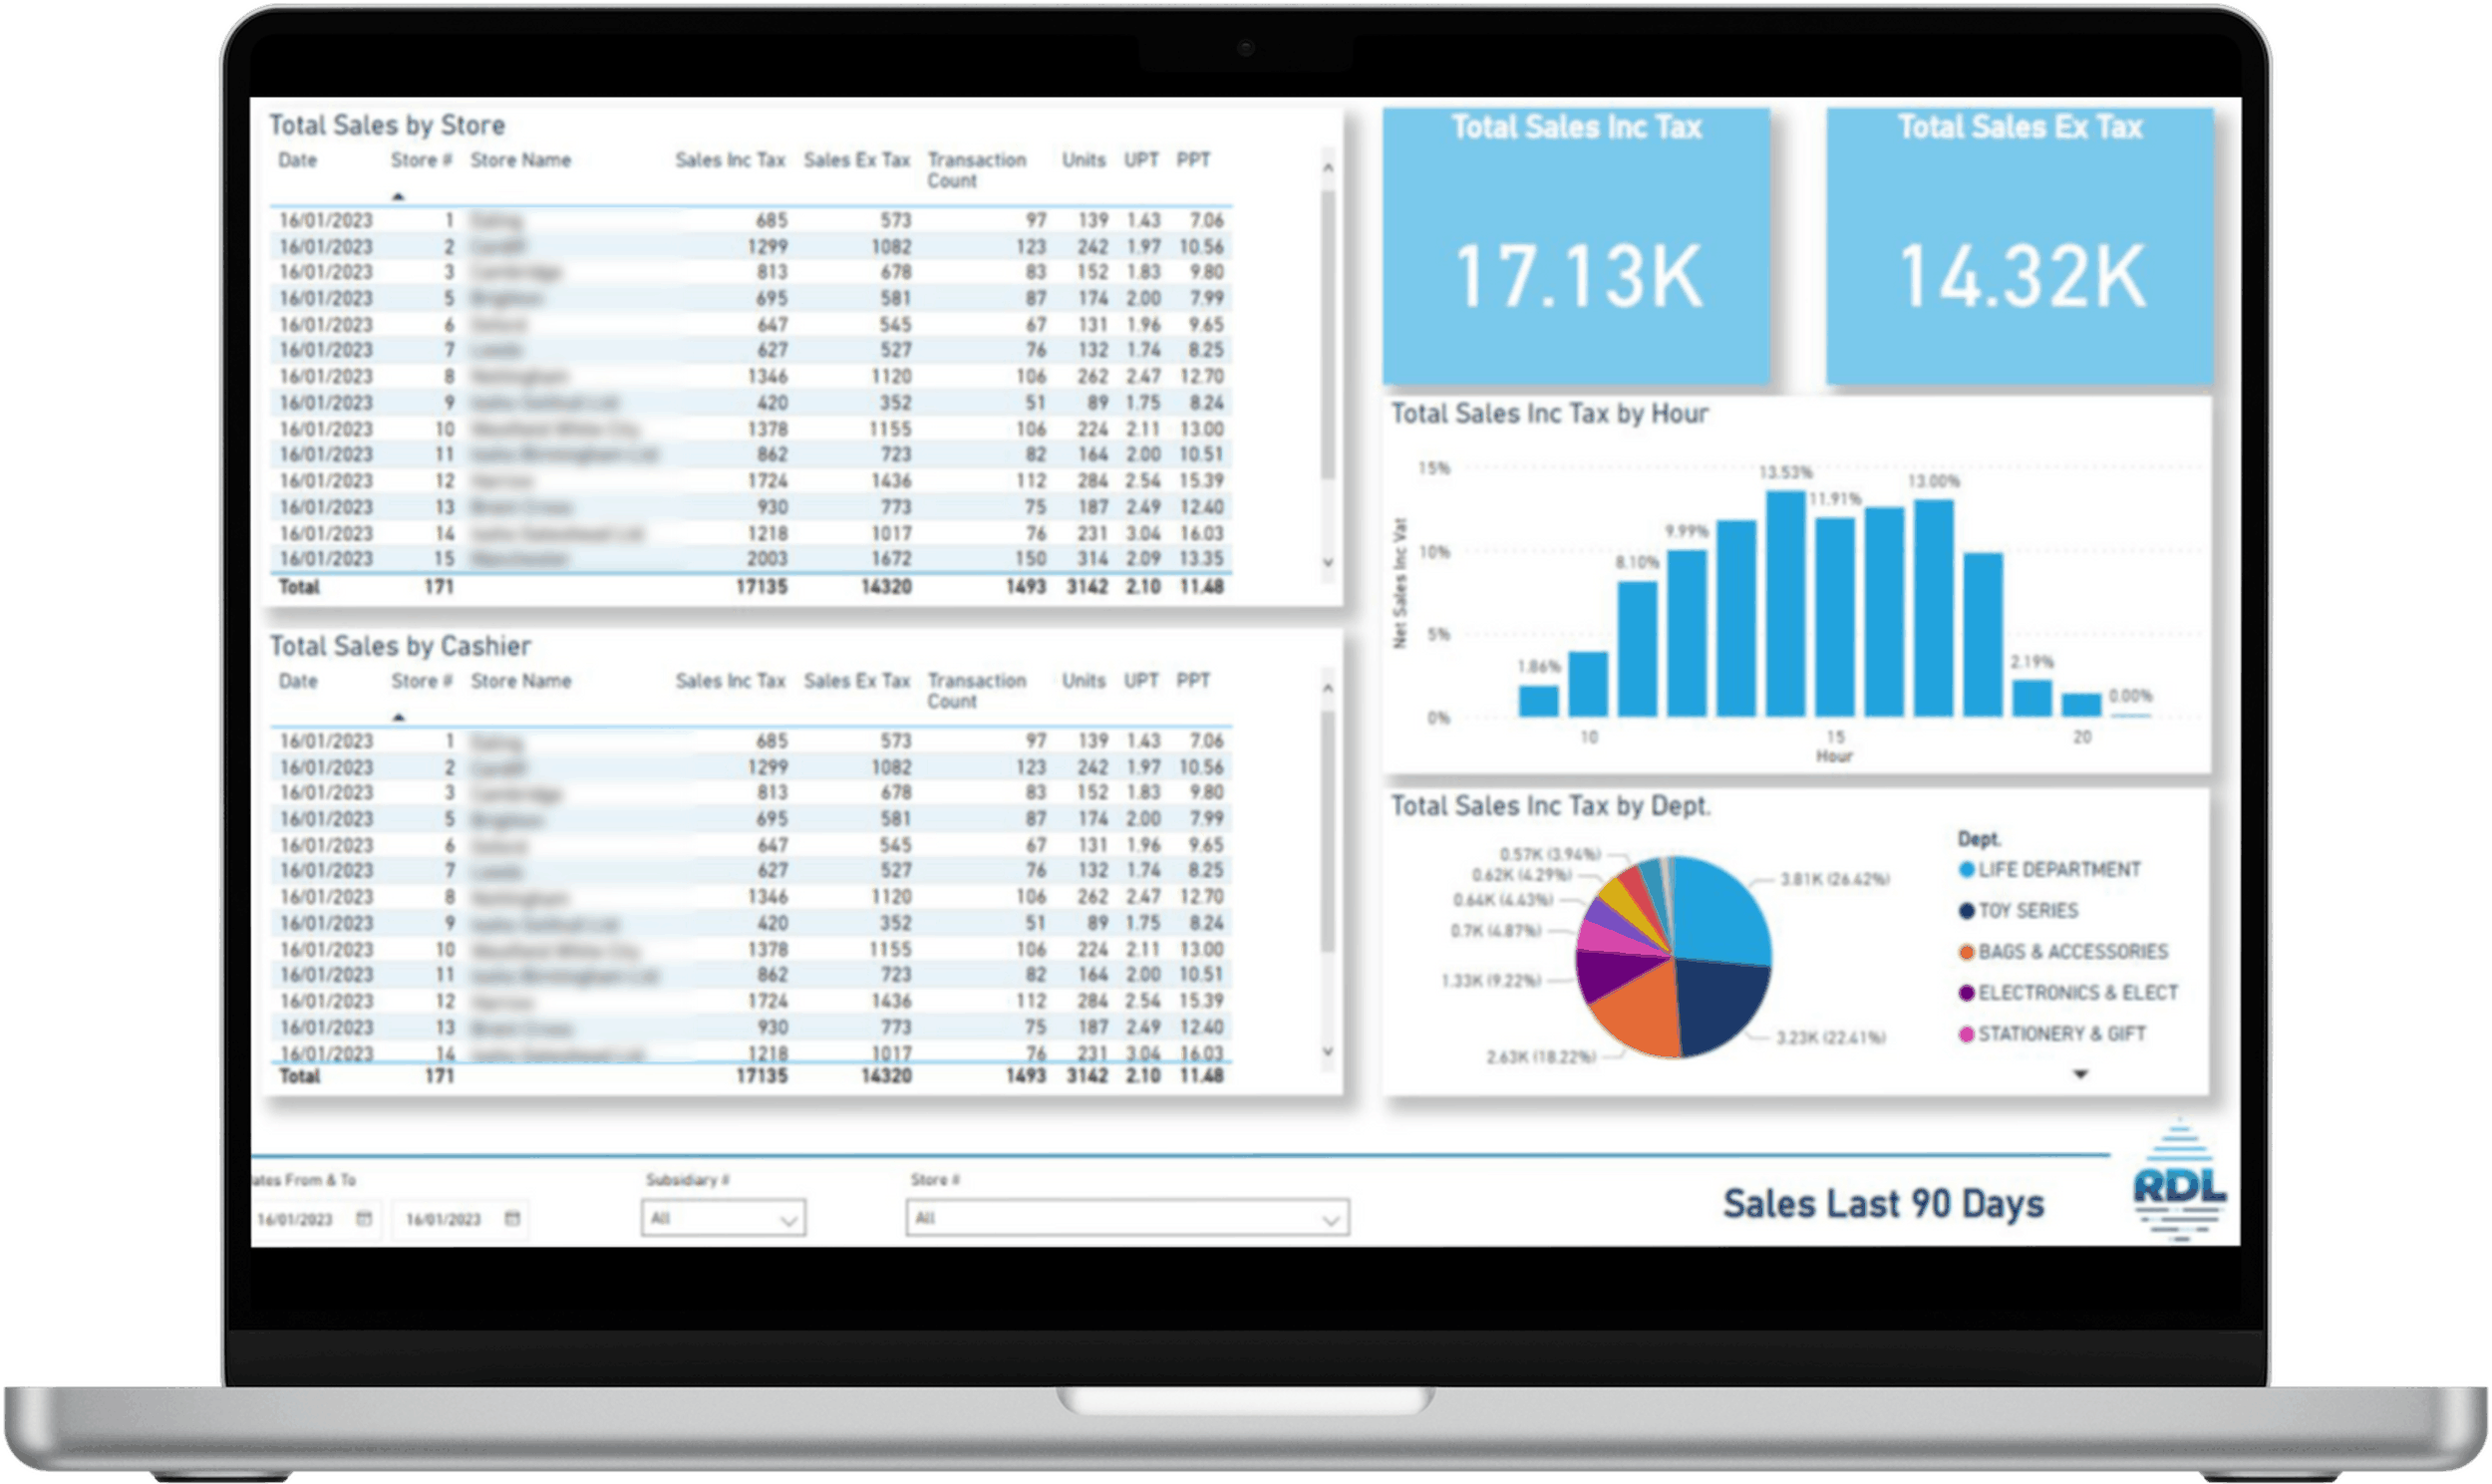
Effortless Integration Meets Intelligent Analytics
Simple Set-up
Installation is free and takes less than 90 minutes. We deal with the complete setup, including publishing out-of-the-box reports to Power BI.
Unified Data
All your data in one place. Extract data from Retail Pro Prism and V9, Oracle, Shopify, D365 and MySQL databases. Plus, with the injector license add-on, you can inject data from other database sources into the data lake, via direct database connection or via an available API.
Flexible and Customisable
Transforms the data into easy-to-report line level and summarised data, simplifying your ability to “Build Your Own Reports” without understanding the complexities of the underlying data.
Flexible Extraction Engine
Customisable extraction routines allowing you to give different priorities to table data within the database, Sales every 5 minutes but Goods Receiving data once an hour - that's fine, you choose.
Inject Your Own Data into RDL
From a CSV or a SQL query you can schedule external data to be imported into the RDL database allowing for cross-system analysis.
Cross-Platform
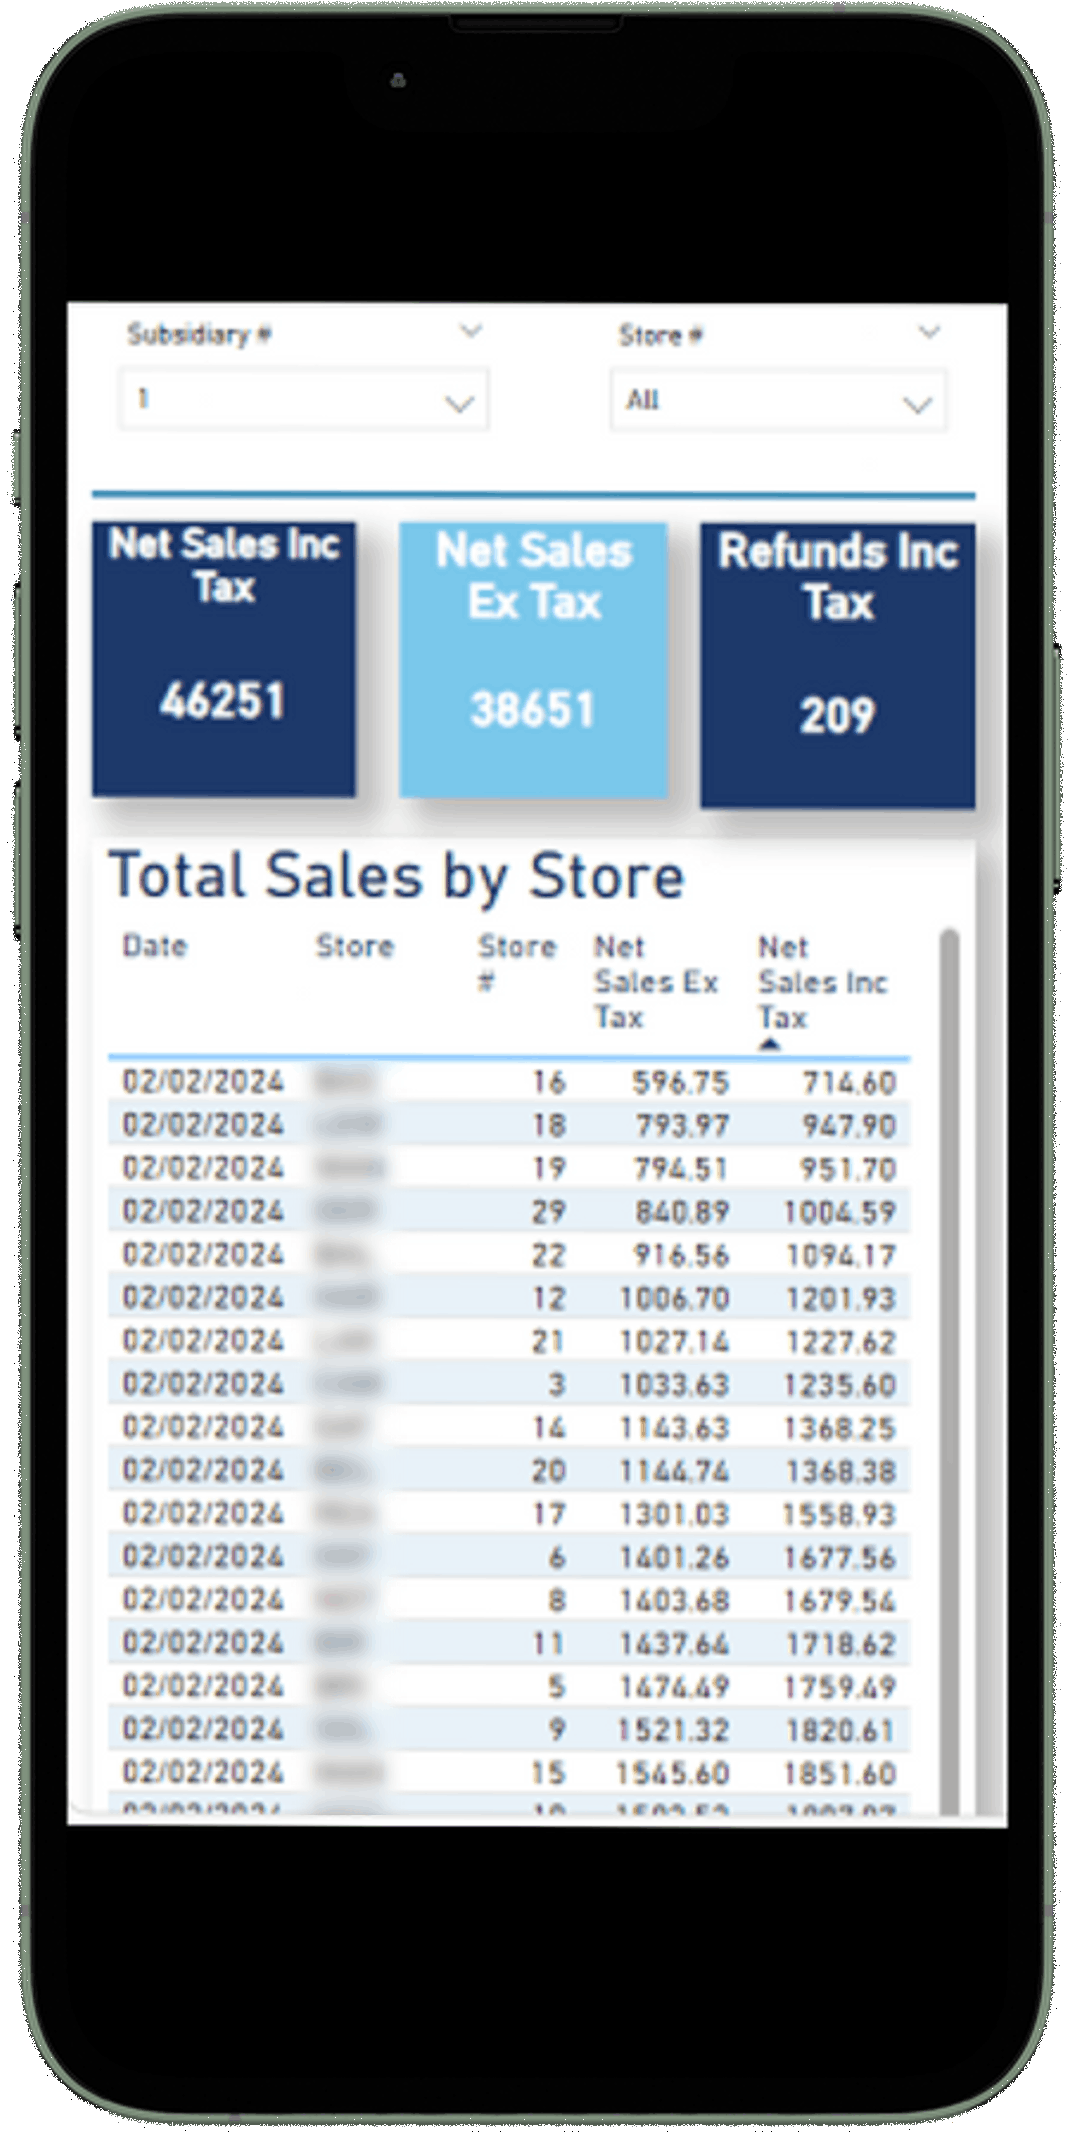
Allows data to be consumed in the Browser or using the Power BI Mobile App available for IOS & Android devices.
Why Another Reporting Solution?
Create the Dream Team with Retail Data Lake and Power BI
Protect Data During Upgrades
Worried About Data Loss When Upgrading?
Upgrade from Retail Pro Version 9 to Prism 2.5 and beyond with confidence, knowing that all data is securely stored in the Retail Data Lake database, eliminating migration risks.
Unlock Actionable Insights
Fed up with the lack of actionable reports in Retail Pro?
Aligns Retail Pro with an appropriate-calibre Reporting/ABI solution, bringing your deep EPOS data to life.
Multiple Source Data Comparison
Need the ability to compare statistics from Various Data sources?
Easily cross-compare with other sources instantly. No development required, with an extensive selection of connectors.
Expand Your Reporting Capabilities
Looking for broader reporting options?
Extends the Data held at the Subsidiary and Store Level to expand reporting options, including Region, Brand, and Division.
Save Time with Pre-Built Reports
Tired of wasting time building new reports from scratch?
Save time with our high-quality, accurate pre-built reports expertly crafted by Retail Pro and Power BI specialists. Effortlessly create your own custom reports by dragging and dropping from a selection of ready-made visualisation blocks.
Our Journey is different!
Our Journey is different; we extract , transform and load your Retail Pro data to custom schedules using our Retail Data Lake application.
‣
‣
‣
‣
‣
‣
‣
‣
‣
‣
‣
‣
‣
‣
‣
‣
01 ‣ Extract & Inject
Extract data from Prism, V9, Oracle, and Mysql databases, then perform
SQL and CSV injections to enhance Retail Pro data.
02 ‣ Transform & Load
We provide a selection of summary tables to prevent querying larger datasets than necessary.
We provide Power BI with an optimised data set by loading the new data into a MariaDB database and removing inconsequential data.
Base level Store and HQ Power BI Data Sources with Metrics including “Margin”, “UPT”, “PPC”, “Weeks Cover”, and “StockTurn.”
03 ‣ Paginated Reports
We continue our transformation journey with Power BI to deliver stunning visualisations with just a click.
RDL includes over 50 ready-made Store and HQ reports, or you can easily create a custom report in no time, aided by our pre-built drag-and-drop data sections.
04 ‣Share
Reports can be exported with ease. They may be scheduled for email delivery and exported to PDF, Excel, or PowerPoint formats.
Additionally, they can be embedded within Teams, SharePoint, or your website.
Take Action Quickly with Alerts and Scheduling
Action Alerts
Alerts can be set to trigger where data exceeds any thresholds you set, ideal for tracking Margin, Onhand Value, and Refunds for example.
Polling / Replication Checks
Ability to advise by email all documents that aren’t in the server, but exist in the store.
Application Health Alerting
When things don't look right, we proactively email your nominated support team.
Application History
Easy to view historical scheduler and extraction history data to help manage the performance of your activity.
Speed Up and Simplify Reporting
Harness the potential of Microsoft Power BI to visualise your data.
Microsoft Power Bi achieved the “Gartner Customer Choice Award for 2022 Analytics and business intelligence (ABI) Tool” with an 82% recommendation rating.
Reports in Seconds!
50+ ready-made Store and HQ reports created by Retail Pro and Power BI experts. Easily build custom reports using pre-built drag-and-drop data sections.
Extended Date Options
Report on Day, Week, Month, Quarter, Year, Days Ago, Months Ago, Years ago from prebuilt fields in the RDL dataset. Combined with the Power BI date-based filters, this provides unrivalled flexibility.
Share Reports with Ease
Reports can be exported with ease. They can be scheduled to email, exported to PDF, Excel, or PowerPoint and embedded in Teams, SharePoint, or your Website. With paginated reports for Power BI, supplying paginated reports in Excel by email is available.
Data Analysis in Excel
Connect your Power BI Data Sets to Excel seamlessly with no additional technology required, enabling easy Excel analysis of Retail Pro data with live connections to Excel.
Artificial Intelligence
To gain further insights, you can use AI predictive reporting and “Natural Language Queries”. There are several useful tools and visuals that help users explore their data with AI.
Smart Data Discovery and Visualisation in Power BI
Visualise Your Data with Ease
Create Smarter Reports with Built‑In AI
Turn Data Into Insights quickly. Generate your reports with Power BI's integrated AI features.
Build Your Own Custom Reports
Watch how simple it is to create your own reports using our ready-made drag-and-drop sections.
Make The Most of Your Data

Sales Analysis
Analyse your sales data in real-time to help identify trends and patterns that can be used to make better sales decisions. For example, it can help determine which products are selling well, which products are not selling, and which products are being returned.
Measure Performance Against Target
Gain insights into abandoned and pending receipts at your till points, centrally stored along with your business data.

Customer Insights
Gain insights into your customers by identifying customer trends, preferences, and behaviours. Use this knowledge to help enhance customer service and marketing initiatives.
Abandoned Receipts
Gain insights into abandoned and pending receipts at your till points, centrally stored along with your business data.

Inventory Management
Manage your inventory more effectively. Retail Data Lake can provide insights into which products are selling quickly and which are not. This information can help optimise inventory levels and ensure the right products are in stock at the right time.
Quality Control
Improve product quality and reduce defects by monitoring the quality and performance of your products and identifying areas where improvements can be made.

Inject into RDL external data
Add new tables into RDL and schedule local file CSV imports to the table, or connect to a database and schedule to run a query to update the table.
Document Replication Monitoring
Monitor your Prism POA data consumption and production, identifying bottlenecks & trends .
What’s New
Shopify Integration
Shopify reporting, aligned to Retail Pro Data. Web sale importer to Prism/V9 & In stock Quantity exporter from Prism to Shopify.
Autone Integration
We can extract your data from Prism or other reachable databases & provide Autone with data to analyse and produce recommended inventory movement decisions. We can also receive data from Autone's post-analysis to share with your retail teams, enabling them to take action.
Data Injectors
Allows us to inject custom tables into the data lake from any reachable database we can query, and API connections available. (additional licenses required)
Data Exporters
Allows us to export data to CSV, TXT, and Parquet file types to a local folder, SFTP, or Azure Blob Storage for ingestion into other tools. (additional licenses required)
Coming Soon
E-Reporting for the French Market
Q3 2026
We will be launching a feature to provide e-reporting for the French Market. Not only will we be providing this service to Retail Pro clients, but any client needing their POS system to e-report. (separate licenses required)
Store-Based Reporting
Q3 2026
Our SBR application works with Retail Pro Prism, extending the UI to deliver grid-style reporting to CSV or PDF from the till point, enabling users to access real-time data to support store operations. (additional licenses required)
Reporting as a Service
Q4 2026
We offer packages tailored to your needs, allowing us to take the burden off your internal teams when creating, publishing or maintaining Power BI reports